You should spend about 20 minutes on this task.
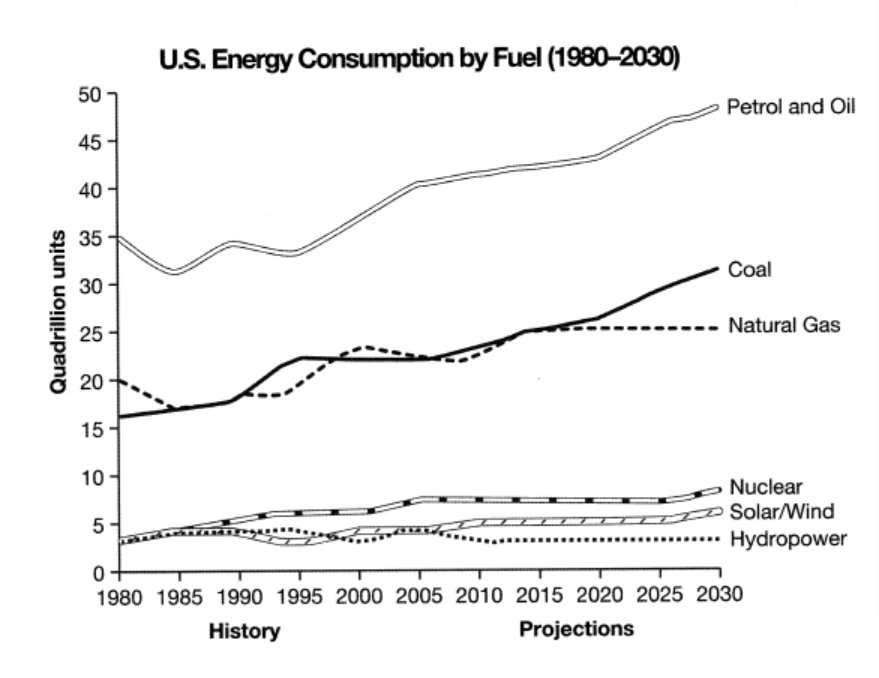
The graph below gives information from a 2008 report about consumption of energy in the USA since 1980 with projections until 2030.
Summarise the information by selecting and reporting the main features, and make comparisons where relevant.
Write at least 150 words.
Exam Prediction
Task2
Task1
Toast
Số từ: 0 / 150
Talkface
Liên hệ chúng tôi
Có câu hỏi? Vui lòng liên hệ với chúng tôi tại: info@Talkface.ai
'/%3e%3c/svg%3e)