You should spend about 20 minutes on this task.
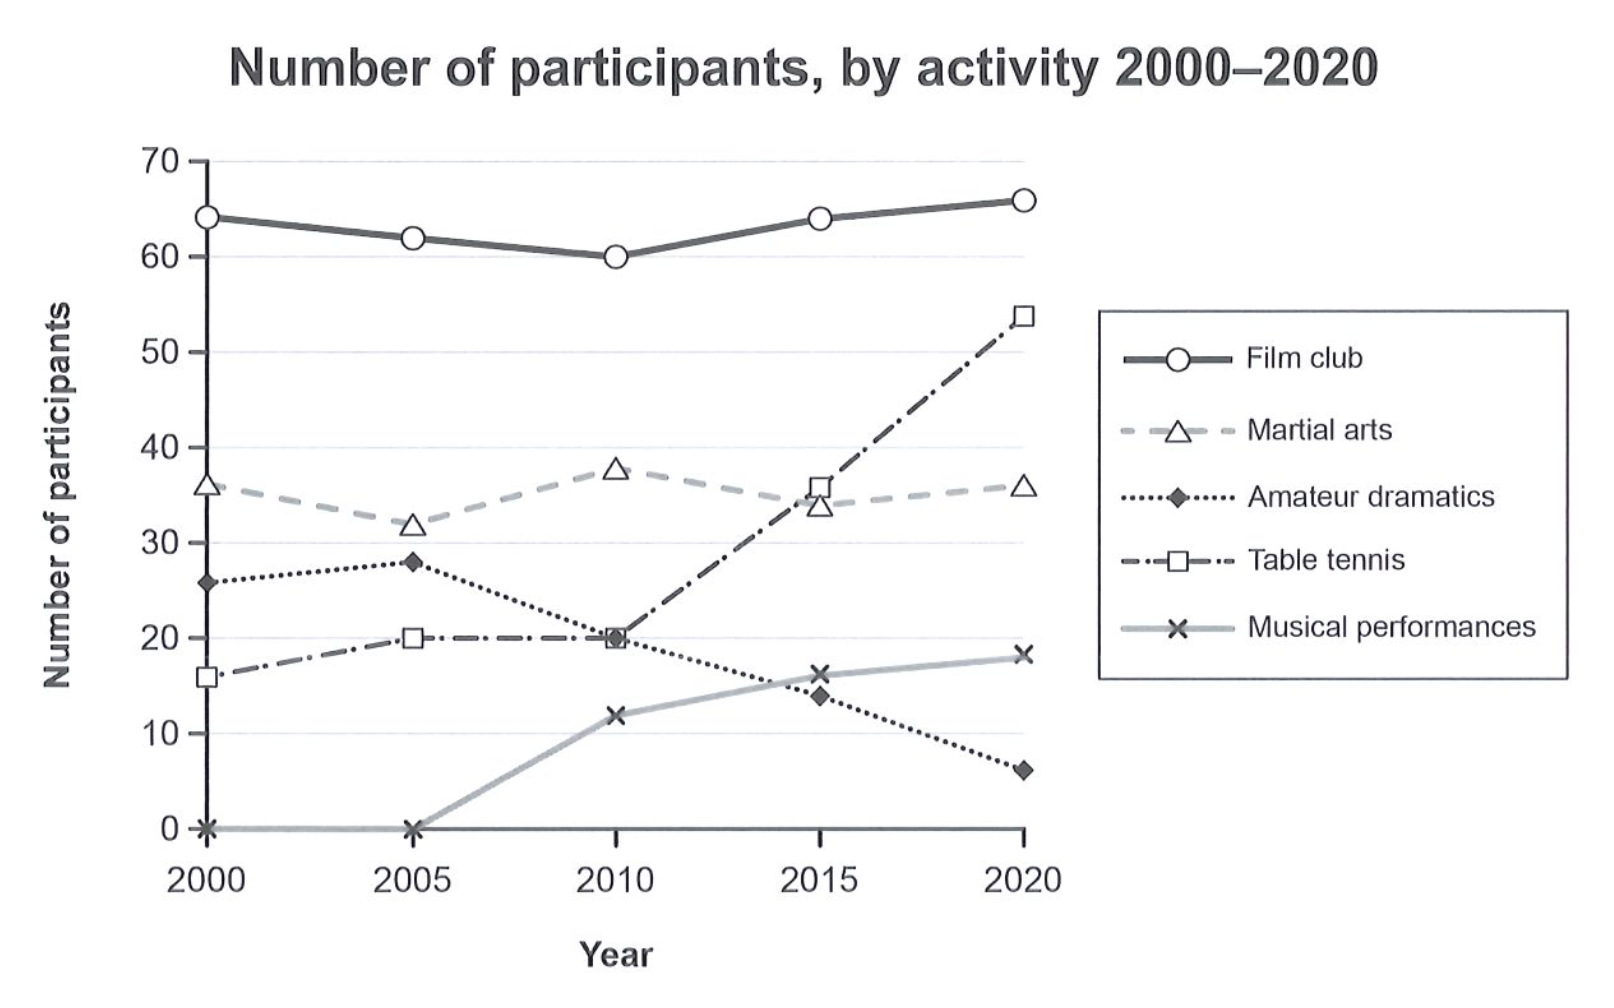
The graph below gives information on the numbers of participants for different activities at one social centre in Melbourne, Australia for the period 2000 to 2020.
Summarise the information by selecting and reporting the main features, and make comparisons where relevant.
Write at least 150 words.
Exam Prediction
Task2
Task1
Toast
Số từ: 0 / 150
Talkface
Liên hệ chúng tôi
Có câu hỏi? Vui lòng liên hệ với chúng tôi tại: info@Talkface.ai
'/%3e%3c/svg%3e)