You should spend about 20 minutes on this task.
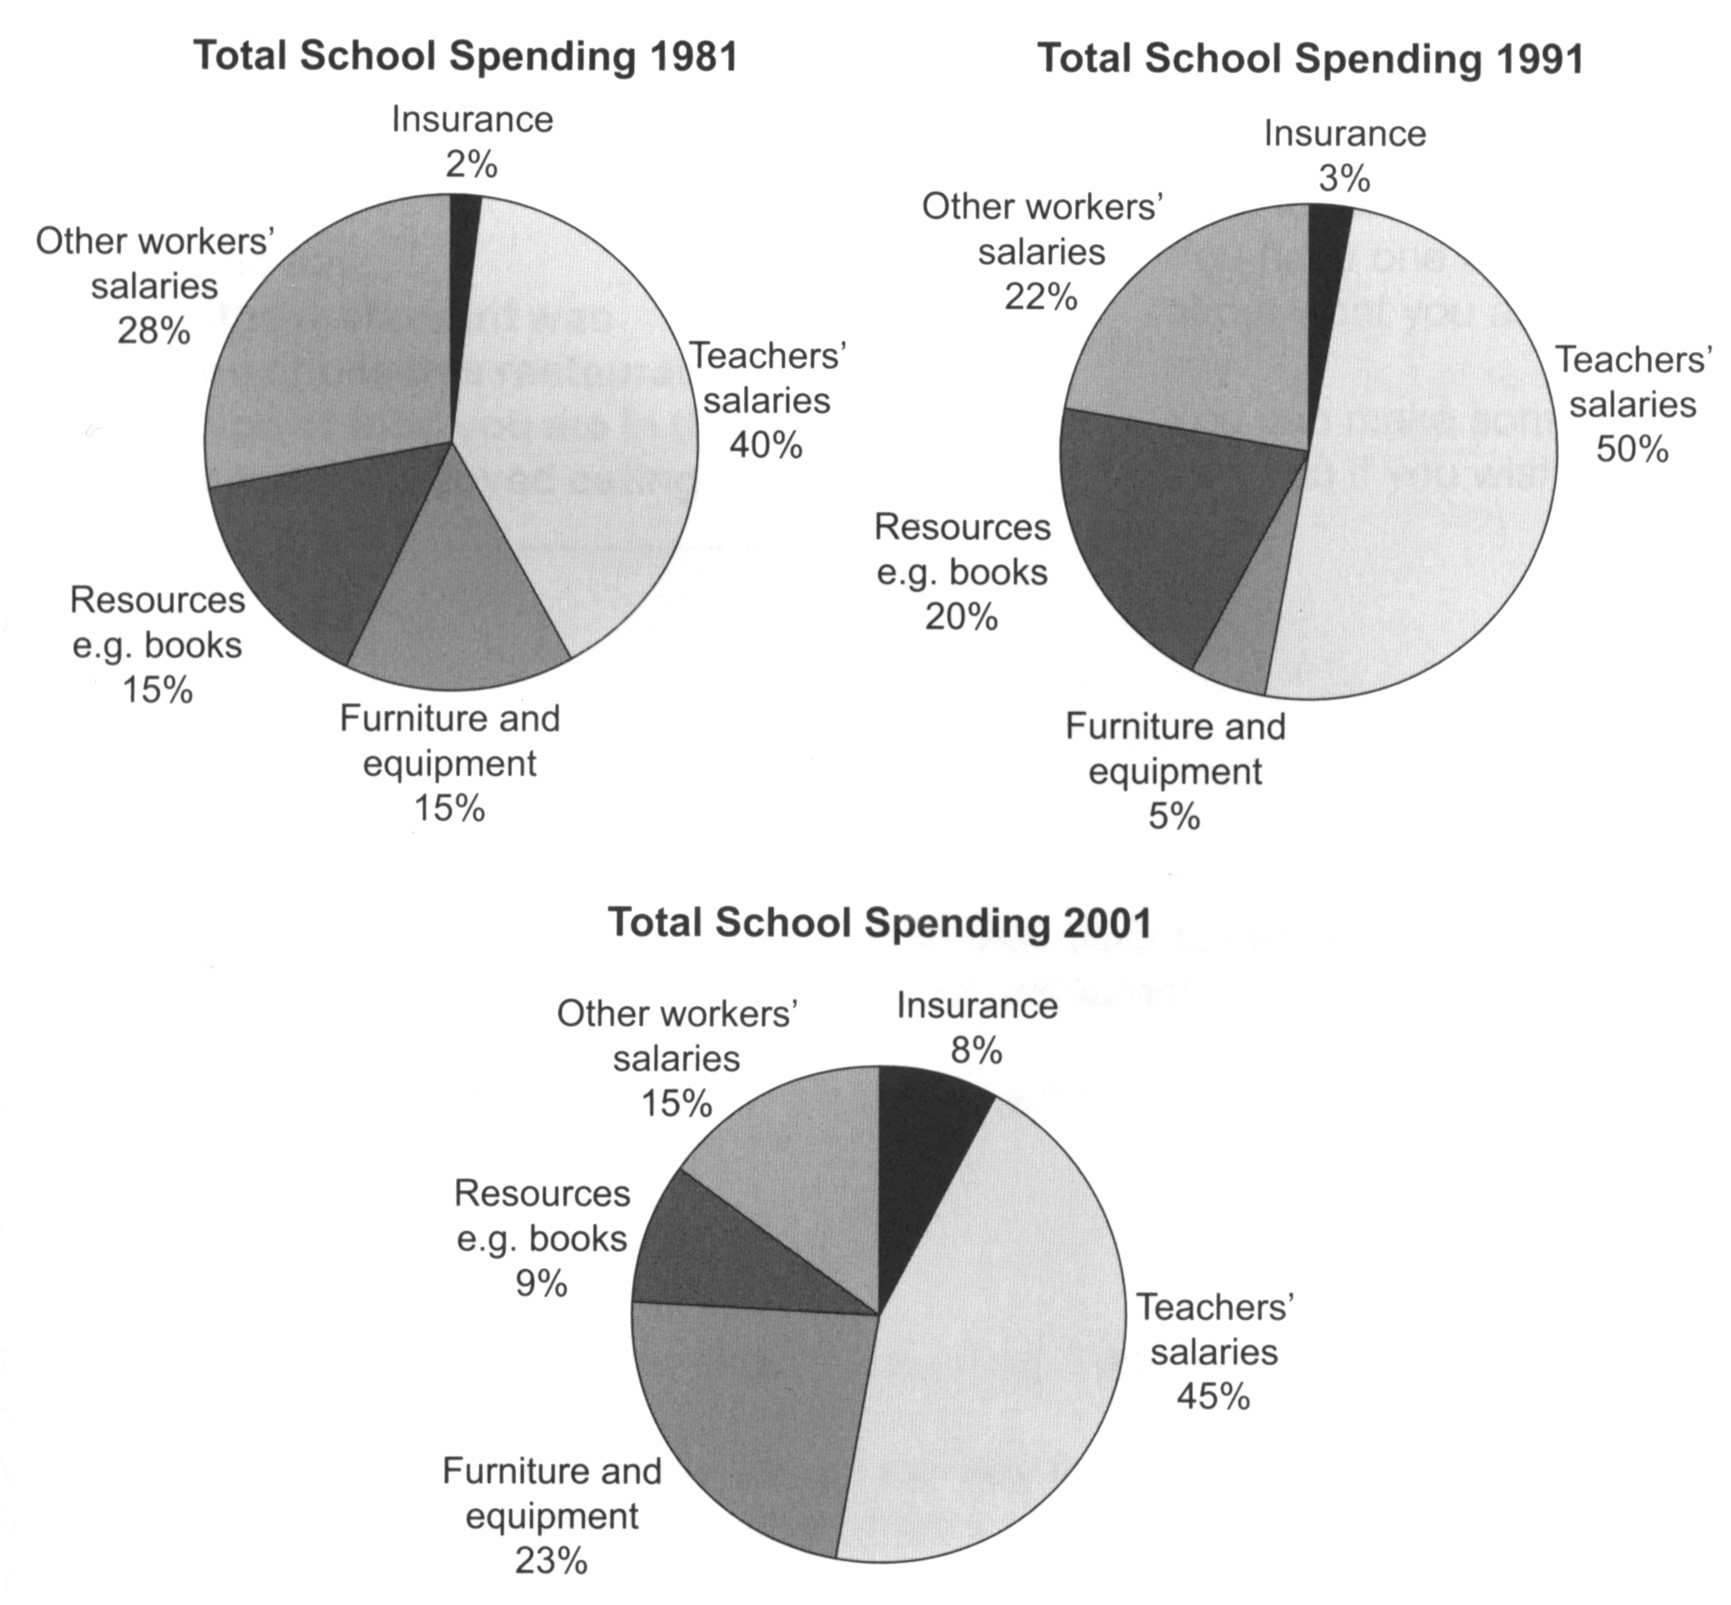
The three pie charts below show the changes in annual spending by a particular UK school in 1981, 1991 and 2001.
Summarise the information by selecting and reporting the main features, and make comparisons where relevant.
Write at least 150 words.
'/%3e%3c/svg%3e)